In 2019, a documentary film was made about her, and her archives named Recorder: The Marion Stokes Project.
Her collection was archived by the Internet Archive which is available here.
Today, August 23, 2023, ISRO's Chandrayaan-3 lunar exploration mission successfully landed on the moon at 6:04 PM IST (5:34 AM PT). The mission was launched on a Bahubali LVM3-M4 rocket carrying a lander named Vikram and a rover named Pragyan on July 14 this year which I had logged here.
With this landing, India has become the fourth nation to make a soft landing on the moon, after the former Soviet Union, the U.S. and China. It has also become the first country to land on the lunar south pole, which is still an unexplored area.
ISRO's Tweet on the successful landing:
Chandrayaan-3 Mission:
— ISRO (@isro) August 23, 2023
'India,
I reached my destination
and you too!'
: Chandrayaan-3
Chandrayaan-3 has successfully
soft-landed on the moon 🌖!.
Congratulations, India!#Chandrayaan_3#Ch3
Below is the saved live stream of the landing on YouTube. The final phase of the descent starts at 35:13.
ISRO tweeted the first images received from the lander:
Chandrayaan-3 Mission:
— ISRO (@isro) August 23, 2023
Updates:
The communication link is established between the Ch-3 Lander and MOX-ISTRAC, Bengaluru.
Here are the images from the Lander Horizontal Velocity Camera taken during the descent. #Chandrayaan_3#Ch3 pic.twitter.com/ctjpxZmbom
Earlier on November 10, 2009, with the Chandrayaan-1 mission, ISRO made a deliberate crash landing of its Moon Impact Probe (MIP) which helped discover water molecules on the moon.
 |
| Photo by Nikolay Kovalenko on Unsplash |
According to Wikipedia, "web scraping, web harvesting, or web data extraction is data scraping used for extracting data from websites." In this post, we will create a small program in Python to scrape top headlines from Times of India's news headlines page using the BeautifulSoup library.
 |
| Top news headlines |
Particularly, our program will fetch the Times of India Headlines page and extract the prime news headlines on the top of the page. As of this writing, the page displays 6 headlines in that section which we want to scrape. In this screenshot of the webpage, our point of interest is the highlighted section which contains the top 6 headlines.
The programming language we will use is Python 3. Along with that, we will also use the BeautifulSoup 4 package for parsing the HTML. I will assume that you already have a system on which these prerequisites are installed and ready to run. I will also assume that you have a Python editor and compiler to compile and run the program. For the purpose of this illustration, I will use Google Colab to write and execute the python code.
To start with, we will write a simple code that fetches the data and outputs the scraped text in the editors output window. Type the following code in your Python editor. I will explain the code later in this post. A copy of this code is available at my TOITopHeadlines v1.0 repository on Github.
 |
| News headlines scraped using Python |
If you have managed to get that working, congratulations. You have scraped the top headlines and now you can use it in your own creative ways. Next, we will delve into what we did and what got us here.
Now, take a look at the portion of the source code that goes through a chain of for loops to crawl into the HTML tags. This exactly corresponds to the way that the markups are structured in the web page. You can take a look at the HTML markups by going to the browser's Developer Tools and inspecting the code behind the UI elements.
 |
| Inspecting HTML tag structure |
Your program has to be tuned according to the HTML markup structure of the page that you are trying to scrape.
Now that our program can successfully scrape the data, in this section, we will take a step forward and write the scraped data into a JSON file in Google Drive. We will continue to use Google Colab to run the program.
For this we will mount a root folder in Google Drive and create a folder to store our files. We use a list of dictionaries and then use Python's JSON library to write the list to a JSON file. A copy of this code is available at my TOITopHeadlines v2.0 repository on Github.
Executing the code in Google Colab will display a prompt to connect to Google Drive and then take you through a series of pages to authenticate using your Google id. Once you are past the authentication the code should execute and create a JSON file in the folder path that you chose in the program. Below you can see how a list of files would look like.
 |
| JSON files in Google Drive |
 |
| The JSON output |
A word of caution on using the web scraping method is that while many websites don't mind, there are many who don't like it. It is best to go through their terms of service to understand the limitations they apply to what you can do with the data and ensure that you are not in violation. Another important point to remember is that many websites periodically change their look and feel hence modifying the structure of the HTML. On the face of such changes, your web scraping logic may fall flat, hence web scrapers need continuous maintenance. A better way to capture and harvest such data is to use APIs published by the web sites. This demonstration is for academic purposes only.
Happy scraping!
Customers of First Energy Ohio today received an email with the subject Ohio Electricity Litigation: Your Digital Payment is Ready stating the distribution of settlement fund against Smith v. FirstEnergy Corp., et al., Case No. 2:20-cv-3755.
For a background, this is based out of two class action lawsuits against FirstEnergy and Energy Harbor, alleging that they engaged in a bribery scheme to pass a law that increased electricity rates for some Ohio residents. The lawsuits have reached a settlement of $49 million for the affected customers. Customers who have paid any rates or fees under Ohio House Bill 6 ("HB 6") from January 1, 2020 to June 22, 2022 to Toledo Edison, Cleveland Electric, or Ohio Edison, may be eligible for a payment out of this settlement.
The official website for the class action lawsuit is here.
Below is the text of the email.
 |
| Ohio Electricity Litigation settlement distribution email |
Getting the payment involves clicking on a button to receive a Virtual Prepaid Mastercard which can be added to your preferred digital wallet (Google Pay, Apple Pay, and Samsung Pay).
 |
| Virtual Prepaid Mastercard |
Sankey diagrams are a great way of visualizing the flow of data, where the width of each flow is based on its quantity or relative weight. Like a picture that speaks more than a thousand words, a Sankey diagram speaks more than a thousand pie charts. Perfect use cases of these diagrams are to visualize the flow of materials and money, but there is no limit on how creatively they can be used.
Here is a sample Sankey that shows the vacation budget flowing into different heads.
 |
| Sankey diagram for a vacation budget |
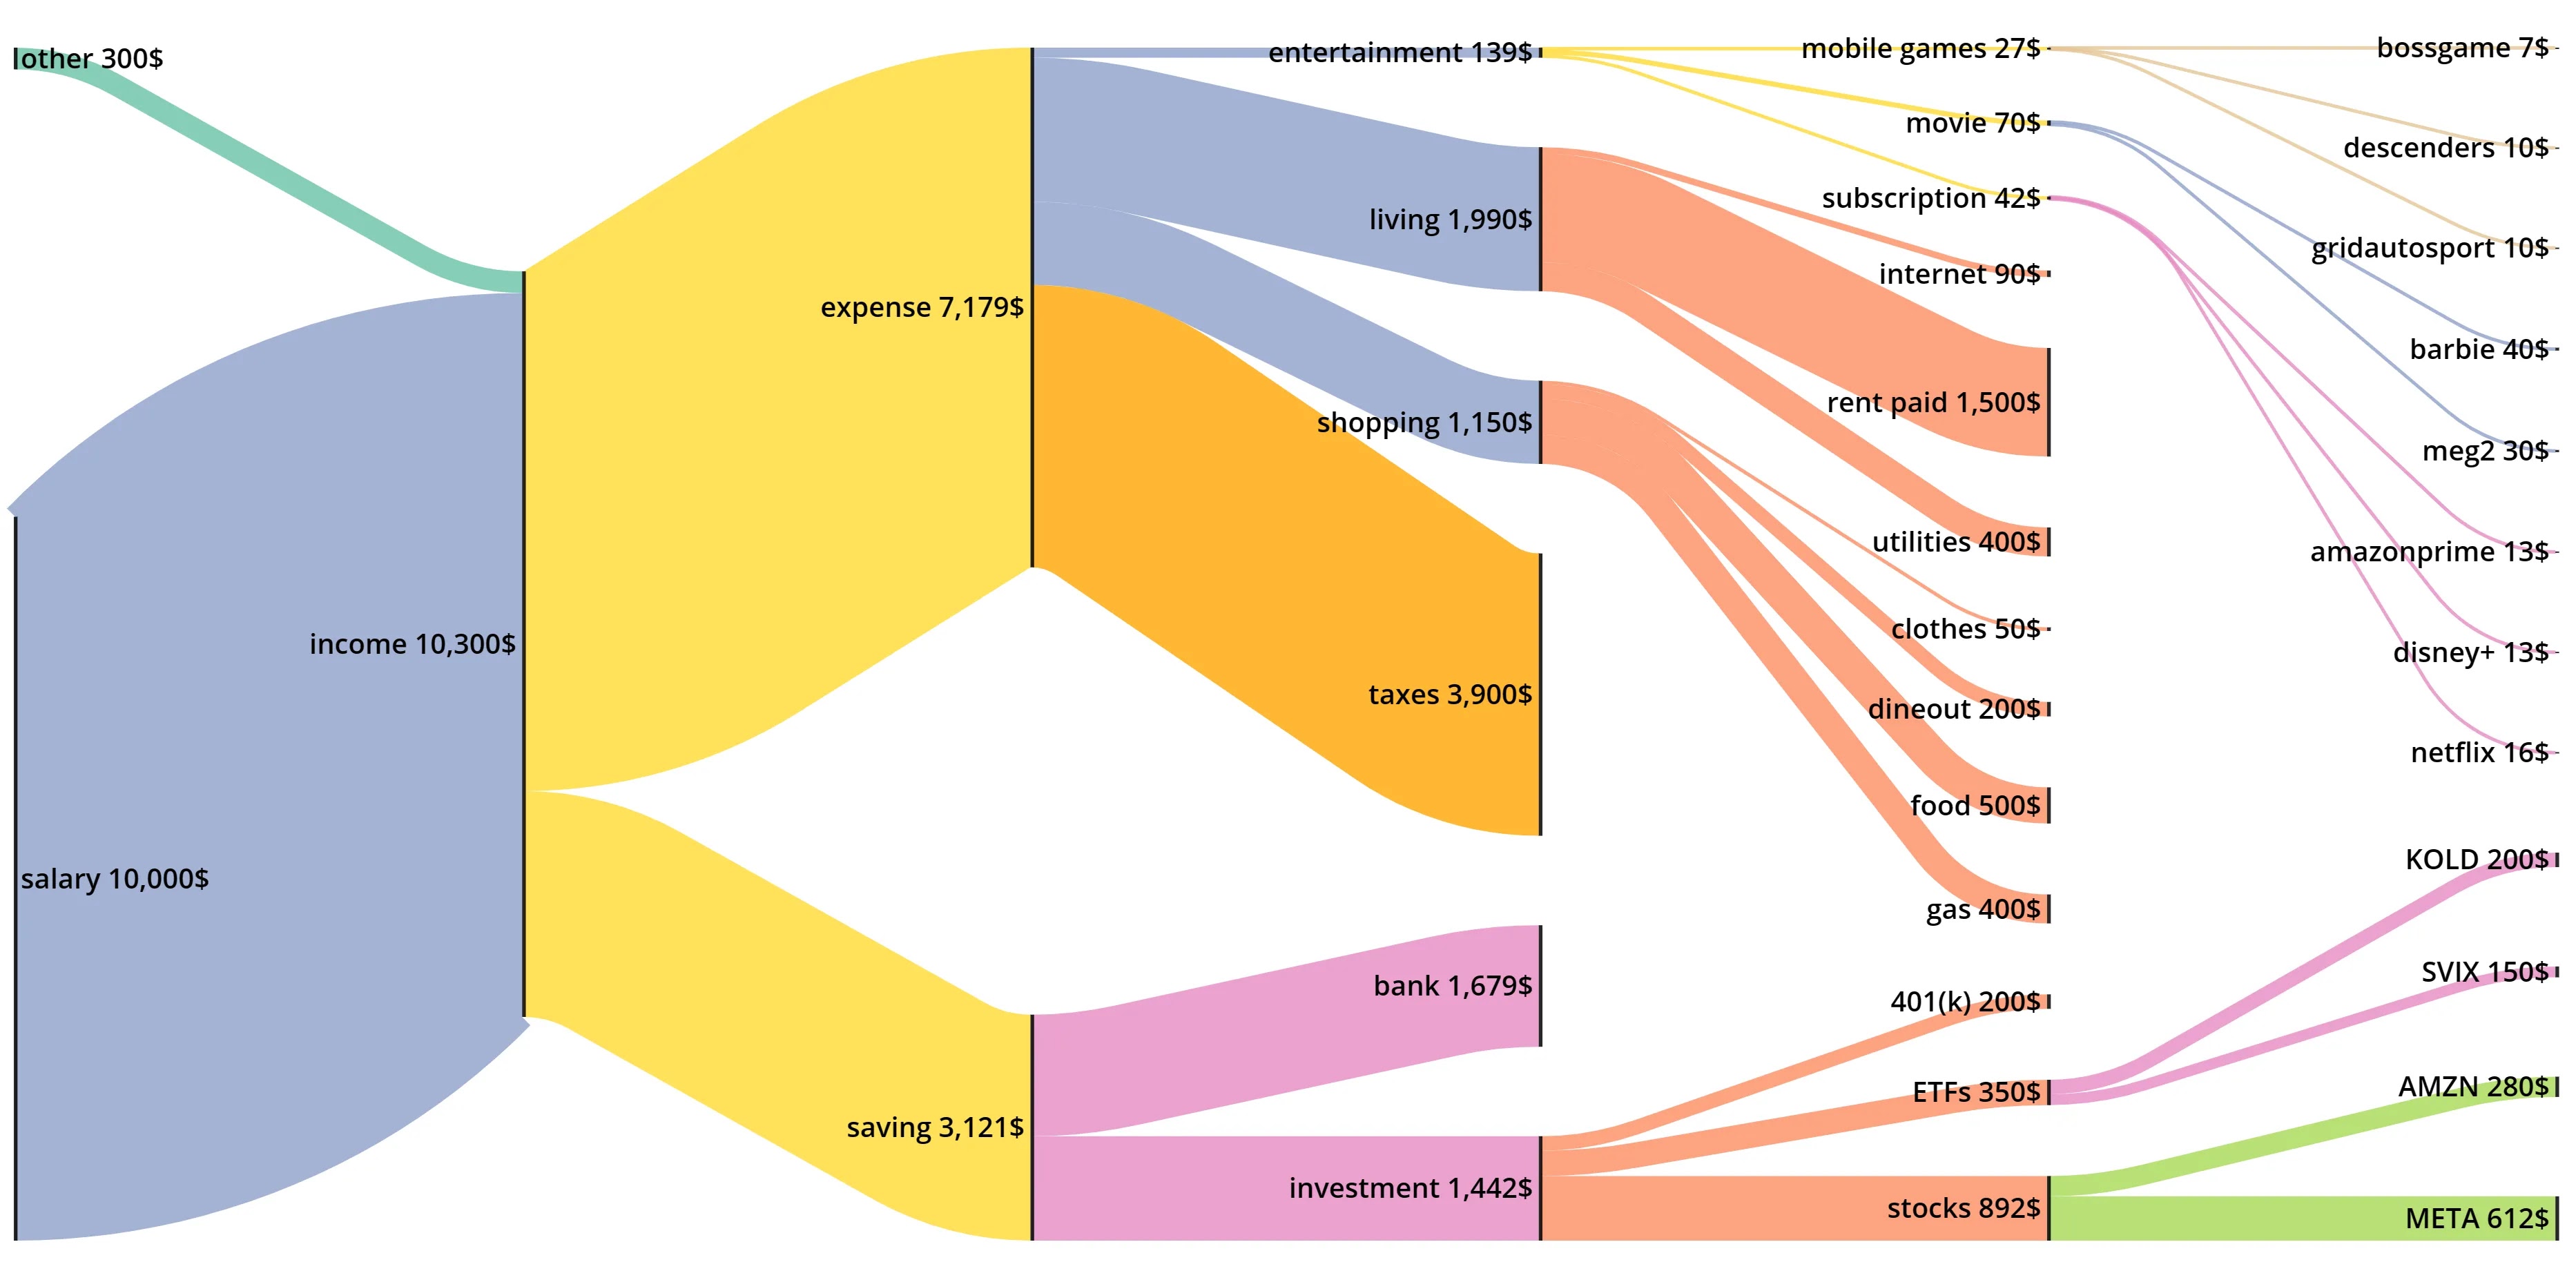 |
| Sankey diagram for a monthly budget |
 |
| Sankey diagram for music revenue based on media type sales |
 |
| Sample at SankeyDiagram.net |
 |
| Sample at SankeyMATIC |
 |
| Sample at Sankey Diagram Generator |
 |
| Sample at Google Charts |
The simple Sankey diagram below was made with Google Charts and depicts the top 10 Wikipedia pages and their source based on page views for the year 2022. Hover your mouse pointer, or tap, over the nodes and flows to see the data. [Data source: Wikipedia] [static image sample]
The Sankey diagram below, which was made with Google Charts, shows UK studio albums released by The Beatles grouped into genres. [Data source: Wikipedia] [static image sample]
You will come across many other tools to create Sankey diagrams. The ones I chose to write about here are the ones that are freely accessible and fairly easy to use. Sankey diagrams can be used to depict much more complex scenarios of data or materials flow. If you have a comment, please drop it in the comments section below.