Showing posts with label google-sheets. Show all posts

Monday, June 3, 2024

Import Latest NAV of Mutual Funds from AMFIndia.com into Google Sheets

Mutual funds are a popular investment vehicle and staying updated with the latest Net Asset Values (NAVs) is crucial for investors to make informed decisions. One of the most efficient ways to track these values is by importing them directly into Google Sheets, which allows for real-time updates and easy analysis. In this blog post, I'll guide you through the process of importing the latest NAV of mutual funds from the Association of Mutual Funds in India (AMFIndia.com) and displaying them in Google Sheets to use the data for various calculations. 
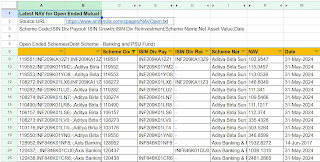
Mutual Funds latest NAV report
One thing I want you to be aware of is that the real-time NAV of your chosen mutual fund is also available in Google Sheets using the GOOGLEFINANCE formula which I have explained in detail in the post How to get stock prices from Google Finance in Google Sheets. Here, the difference is that while the GOOGLEFINANCE formula returns the price of a specific fund, the method which I explain here imports the full list of available funds and their NAVs in your spreadsheet which you can play with later.

If you don't want to go through the hassle of going through this article, I have provided a link to a sample Google Sheets file which you can save for yourself and start using.

Why Use Google Sheets for Tracking NAVs?

Google Sheets offers several advantages for tracking mutual fund NAVs:

  1. Real-time Updates: Google Sheets can automatically update data, ensuring you always have the latest information.
  2. Accessibility: Being a cloud-based platform, you can access your data from anywhere.
  3. Ease of Use: Google Sheets' user-friendly interface and powerful functions make data manipulation and analysis straightforward.
  4. Collaboration: Multiple users can view and edit the sheet simultaneously, making it ideal for collaborative work.

Open-Ended and Close-Ended Mutual Funds

Before we get into the detailed steps of how to accomplish the task we have in hand, here a small description of "open-ended" and "close-ended" mutual funds in India. I will leave you with only definitions here as there are many resources online with more details of the same. The AMFIndia website provides data for both types of mutual funds.

Open-ended mutual funds do not have a fixed maturity period. They allow investors to enter (buy units) and exit (redeem units) at any time at the fund’s prevailing Net Asset Value (NAV).

Close-ended mutual funds have a fixed maturity period. Investors can buy units only during the initial offering period (New Fund Offer or NFO) and can redeem them only at maturity. These funds are listed on stock exchanges, where they can be traded like stocks.

Step-by-step Guide

Step 1: Accessing AMFIndia.com

Firstly, you need to understand where and how to access the mutual fund NAV data on the AMFIndia website. AMFIndia.com typically provides NAV data in a downloadable format directly from the web site

  1. Visit the AMFIndia Website (amfindia.com) using your favorite web browser and find the Download NAV link at the bottom of the page

    AMFIndia Website homepage


  2. The NAV data for "open-ended" and "close-ended" mutual funds are available as separate links like indicated with red boxes in the screenshot below. The data inside the links are structured in the same format as a flat file with semi-colon separated values
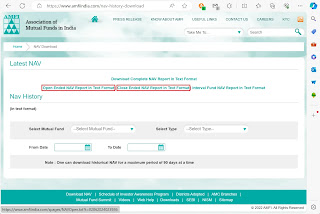
    Latest NAV links


  3. The link to open-ended mutual fund schemes typically looks like https://www.amfiindia.com/spages/NAVOpen.txt and a sample content is shown in the image below
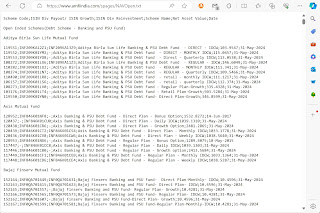
    Open-ended schemes data


  4. The link to close-ended mutual fund schemes typically looks like https://www.amfiindia.com/spages/NAVClose.txt and a sample content is shown in the image below
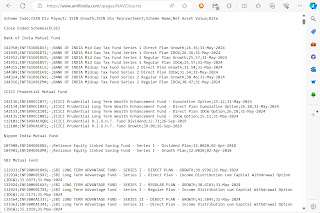
    Close-ended schemes data


  5. As of this writing, access to the AMFI data is available free of cost to all

Step 2: Importing the Data into Google Sheets

To automate fetching the latest NAV data, we will use Google Sheets’ IMPORTDATA formula which can be used to seamlessly import and parse properly structured .csv (comma-separated value) or .tsv (tab-separated value) data from a URL. Here in our case, the data is not comma separated and there are some additional complexities which we will address later. For now, our objective is to get the full data inserted into our spreadsheet. For the sake of simplicity, here I will demonstrate with only the open-ended mutual fund data. The close-ended data URL can be imported and parsed following the same guidelines.

  1. Go to Google Sheets and create a new spreadsheet
  2. In a cell, like B2, enter the URL for the open-ended schemes' data https://www.amfiindia.com/spages/NAVOpen.txt


  3. Next, in the cell from where you want the data import to begin, like A3, use the IMPORTDATA formula. This will import all content from the link into the spreadsheet


  4. Next you can parse and display the data into structured cells in the sheet

Step 3: Parsing the Data in Google Sheets

At this point, your spreadsheet should be filled with data which you imported in the previous step, but you will observe that the data is like a big blob of text which got downloaded and is of not much use unless you can parse and split it into specific columns. It gets a little bit tricky after this which is what we will get into here. Here is a screenshot of how your spreadsheet looks like right now - observe that there are some virtual headers and the bulk of the content is related to one mutual fund scheme per line, with the data values separated with semicolons.


On close observation of the first line, you will notice that it is a description of the columns for each line:

Scheme Code;ISIN Div Payout/ ISIN Growth;ISIN Div Reinvestment;Scheme Name;Net Asset Value;Date

We will use this description to do some simple calculations and parse the date into spreadsheet columns.

Now, look at cell A9 which contains the text: 119551;INF209KA12Z1;INF209KA13Z9;Aditya Birla Sun Life Banking & PSU Debt Fund - DIRECT - IDCW;103.9547;31-May-2024

Our objective is to parse and map this text to the header descriptions which we saw above, like this:

Scheme Code: 119551
ISIN Div Payout/ ISIN Growth: INF209KA12Z1
ISIN Div Reinvestment: INF209KA13Z9
Scheme Name: Aditya Birla Sun Life Banking & PSU Debt Fund - DIRECT - IDCW
Net Asset Value: 103.9547
Date: 31-May-2024

In cell C9 enter the following formula to extract the Scheme Code:

=IF(ISERROR(LEFT(CONCAT(A9,B9),SEARCH(";",CONCAT(A9,B9))-1)),"",LEFT(CONCAT(A9,B9),SEARCH(";",CONCAT(A9,B9))-1))


For our convenience, in cell D9, we will calculate and store the offset from where the search for the next field should start from. So, in cell D9 enter the following formula:

=IF(C9="","",LEN(C9)+1)


Use this same method cyclically to get the other field values into further cells.

In cell E9, use the following formula to extract the value for ISIN Div Payout/ ISIN Growth:

=IF(C9="",A9,MID(CONCAT(A9,B9),D9+1,SEARCH(";",CONCAT(A9,B9),D9+1)-D9-1))

In cell F9, again calculate and store the offset from where the search for the next field should start from:

=IF(C9="","",D9+LEN(E9)+1)

In cell G9, use the following formula to extract the value for ISIN Div Reinvestment:

=IF(C9="","",MID(CONCAT(A9,B9),F9+1,SEARCH(";",CONCAT(A9,B9),F9+1)-F9-1))

In cell H9, again calculate and store the offset from where the search for the next field should start from:

=IF(C9="","",F9+LEN(G9)+1)

In cell I9, use the following formula to extract the value for Scheme Name:

=IF(C9="","",MID(CONCAT(A9,B9),H9+1,SEARCH(";",CONCAT(A9,B9),H9+1)-H9-1))

In cell J9, calculate and store the offset from where the search for the next field should start from:

=IF(C9="","",H9+LEN(I9)+1)

In cell K9, use the following formula to extract the value for NAV:

=IF(C9="","",MID(CONCAT(A9,B9),J9+1,SEARCH(";",CONCAT(A9,B9),J9+1)-J9-1))

In cell L9, calculate and store the offset from where the search for the next field should start from:

=IF(C9="","",J9+LEN(K9)+1)

In cell K9, use the following formula to extract the value for the date:

=IF(C9="","",MID(CONCAT(A9,B9),L9+1,LEN(CONCAT(A9,B9))-L9))

At this point you should see all the fields for the first scheme parsed neatly into columns. Use you favorite method to fill the rows below to parse all rows. The data will automatically get updated whenever you reopen the spreadsheet.


Additional Tips for Formatting Data

Now that you have the basic structure ready, you can name your header columns like you wish. To make your data more readable, you can apply formatting options:


Headers: Bold the header row.

Column Widths: Adjust the column widths to fit the content.

Conditional Formatting: Use conditional formatting to highlight important values.

Hide Columns: Hide the columns that you don't want to see, for example the columns where you calculated the offsets.

Here is how I made my final version look:


Application

You can apply this data in various creative ways, like the bumping the NAVs of your purchases against the current NAV and finding out your profitability using advanced formulas like VLOOKUP.

Conclusion

Tracking the latest NAV of mutual funds is essential for investors, and Google Sheets provides an excellent platform for doing so. By importing data from AMFIndia.com, you can ensure that you always have the most up-to-date information at your fingertips.

You can grab a copy of the spreadsheet from this link. 

With this guide, you should be well-equipped to set up your own system for importing and displaying mutual fund NAVs in Google Sheets. Happy investing!

Troubleshooting Tips 

Web access Issues: Ensure that the website data endpoint is accessible. Check for any authentication requirements. At the time of this writing the data is available free and requires no additional authentication.

Data Formatting: If the imported data doesn't look right, double-check the structure of the data and adjust your formulas accordingly.

By following these steps, you'll have a powerful tool to keep track of mutual fund NAVs, helping you stay on top of your investments with ease.

About AMFIndia

Association of Mutual Funds in India, abbreviated as AMFI, is the association of all the asset management companies of SEBI registered mutual funds in India. [Wikipedia]

Note: This is not a financial advice, and I am not a financial advisor. Mutual funds appearing in the illustrations in this article is for representational purposes only and are not recommendations.


Saturday, October 14, 2023

How to get stock prices from Google Finance in Google Sheets

Google Sheets has a very convenient feature to grab stock prices and other details from its Google Finance service and display in spreadsheets.

Photo by Oren Elbaz on Unsplash

It not only lets you get the latest real-time stock prices but also gets historical prices. This feature can be an interesting add-on to your financial spreadsheets or to build a tracker for your holdings or just to build a simple watchlist.

Get the real-time price of a stock

The simplest way to get the real-time stock prices is to use the =GOOGLEFINANCE() function with just the stock ticker or symbol using the following syntax.

=GOOGLEFINANCE(ticker)

For example, writing the following in a cell would display the current stock price of Apple.

=GOOGLEFINANCE("AAPL")

In Google Sheets, it looks like this:

The =GOOGLEFINANCE() function also accepts several attributes that can be used to get more information about a stock including the name, current and historical prices.

We will get into more examples of using attributes later, but for an example, using the "name" attribute like =GOOGLEFINANCE("AAPL""name") returns the name of the company for the stock ticker.


Creating a watchlist

You can easily create a list of stocks that you want to monitor using the real-time attributes that are available by default with the =GOOGLEFINANCE() function. To use an attribute just add the attribute as a parameter in the function. For example, to get the market capitalization, use something like:

=GOOGLEFINANCE("AAPL""marketcap")

In Google Sheets, it looks like this:


Here are some attributes that can be useful for building a watchlist. For the latest and full list of attributes, refer to this page on Google Support.

  • "price" - Real-time price quote, delayed by up to 20 minutes. This is a default attribute.
  • "priceopen" - The price as of market open.
  • "high" - The current day's high price.
  • "low" - The current day's low price.
  • "volume" - The current day's trading volume.
  • "marketcap" - The market capitalization of the stock.
  • "tradetime" - The time of the last trade.
  • "datadelay" - How far delayed the real-time data is.
  • "volumeavg" - The average daily trading volume.
  • "pe" - The price/earnings ratio.
  • "eps" - The earnings per share.
  • "high52" - The 52-week high price.
  • "low52" - The 52-week low price.
  • "change" - The price change since the previous trading day's close.
  • "beta" - The beta value.
  • "changepct" - The percentage change in price since the previous trading day's close.
  • "closeyest" - The previous day's closing price.
  • "shares" - The number of outstanding shares.
  • "currency" - The currency in which the security is priced.

Using these attributes, a watchlist can be built that looks like this:

Ticker or symbol for a particular stock

The easiest way to get the ticker for a particular stock is to perform a search in your favorite search engine with the name of the company followed by the word "stock".

For example, in Google, search with the keywords "Apple stock" to get the result shown below where the stock ticker is listed as NASDAQ: AAPL.

Now use the symbol in a Google Sheets formula like =GOOGLEFINANCE("NASDAQ:GOOG") to get the current price. Notice that we have removed any blank spaces in the ticker name.

Notice that the symbol contains two parts which are separated by a colon. The part on the left of the colon is the designated exchange code and the part on the right is the symbol or ticker. For US stocks, Google Sheets automatically grabs the prices if you just use the ticker like =GOOGLEFINANCE("AAPL") but for international stocks it is best to specify the designated exchange code along with the ticker with no space in between. To get accurate results and avoid discrepancies it is recommended to always use the designated exchange code along with the ticker like =GOOGLEFINANCE("NASDAQ:AAPL").

To get the ticker of Tata Steel which is listed in the National Stock Exchange in India, a search result would return something like what is shown below.

Now use the symbol in a Google Sheets formula like =GOOGLEFINANCE("NSE:TATASTEEL") to get the current price.


A similar example is the Tessenderlo Group which is listed in the Brussels Stock Exchange, for which you can use =GOOGLEFINANCE("EBR:TESB".

Historical stock price

The historical price of stocks can aid in the analysis for choosing the right pick. The =GOOGLEFINANCE() function can also be used to get this historical data by using these attributes.

  • "open" - The opening price for the specified date(s).
  • "close" - The closing price for the specified date(s).
  • "high" - The high price for the specified date(s).
  • "low" - The low price for the specified date(s).
  • "volume" - The volume for the specified date(s).
  • "all" - All of the above.

To get the list of prices for a stock from a start date to an end date use the following syntax:

=GOOGLEFINANCE(ticker,[attribute],[start date],[end date | number of days],"DAILY")

For example, the following formula gets the daily closing price of the stock between two dates:

=GOOGLEFINANCE("NASDAQ:AAPL","price",DATE(2020,1,1),DATE(2020,1,14),"DAILY")

The following formula can be used to get the closing price of a stock for 8 trading days starting from a particular date:

=GOOGLEFINANCE("NASDAQ:AAPL","price",DATE(2020,1,1),8,"DAILY")

This formula can be used to get the closing price on trading days since the last 30 days:

=GOOGLEFINANCE("NASDAQ:AAPL","price", TODAY()-30), TODAY(),"DAILY")

The following formula will get all the historical attributes of a stock for 8 trading days starting from a particular date:

=GOOGLEFINANCE("NASDAQ:AAPL", "all", DATE(2020,1,1),8,"DAILY")

Charting Historical Prices using SPARKLINE

The =SPARKLINE() function can be used in combination to historical stock prices from =GOOGLEFINANCE() to display a chart in Google Sheets. The following formula will display a chart plotting the price trend over the last 90 days for the Apple stock.

=SPARKLINE(GOOGLEFINANCE("NASDAQ:AAPL", "price",TODAY()-90, TODAY()))

Sparklines can be used to enhance your watchlist to provide a miniature visual on how the prices are trending.


Mutual Fund Prices

The =GOOGLEFINANCE() function can also be used to grab prices of mutual funds. There are several attributes to provide this functionality.

  • "closeyest" - The previous day's closing price.
  • "date" - The date at which the net asset value was reported.
  • "returnytd" - The year-to-date return.
  • "netassets" - The net assets.
  • "change" - The change in the most recently reported net asset value and the one immediately prior.
  • "changepct" - The percentage change in the net asset value.
  • "yieldpct" - The distribution yield, the sum of the prior 12 months' income distributions (stock dividends and fixed income interest payments) and net asset value gains divided by the previous month's net asset value number.
  • "returnday" - One-day total return.
  • "return1" - One-week total return.
  • "return4" - Four-week total return.
  • "return13" - Thirteen-week total return.
  • "return52" - Fifty-two-week (annual) total return.
  • "return156" - 156-week (3-year) total return.
  • "return260" - 260-week (5-year) total return.
  • "incomedividend" - The amount of the most recent cash distribution.
  • "incomedividenddate" - The date of the most recent cash distribution.
  • "capitalgain" - The amount of the most recent capital gain distribution.
  • "morningstarrating" - The Morningstar "star" rating.
  • "expenseratio" - The fund's expense ratio.

For example, to get the last closing price of the Schwab S&P 500 Index Fund, use something like:

=GOOGLEFINANCE("MUTF:SWPPX""closeyest")

A combination of these attributes can be used to create a watchlist that looks like this.


Cryptocurrency Prices

There are limited ways that you can use the =GOOGLEFINANCE() function to grab real-time prices of some cryptocurrencies. At the time of this writing, it works with Bitcoin and Ethereum. To do this use the cryptocurrency symbol that you see in the URL as shown below.


From the URL shown in the example above, you can take the BTC-USD ticker and use it directly like this in a formula.

=GOOGLEFINANCE("BTC-USD")

This will pull the price and display in a cell in Google Sheets.


Conclusion

To sum up, monitoring stocks, mutual funds and cryptocurrency within Google Sheets is a potent method for analyze your holdings. It is user-friendly, adaptable, and doesn't cost a dime. Consequently, you can promptly access both historical and real-time stock information on your spreadsheet. I hope this article holds some helpful information for you.

Here is this posted in LinkedIn.