Google Sheets has a very convenient feature to grab stock prices and other details from
its Google Finance service and
display in spreadsheets.
It not only lets you get the latest real-time stock prices but also gets historical
prices.
This feature can be an interesting add-on to your financial spreadsheets or to build a tracker for your holdings or
just
to build a simple watchlist.
Get the real-time price of a stock
The simplest way to get the real-time stock prices is to use the =GOOGLEFINANCE()
function with just the stock
ticker or symbol using the following syntax.
=GOOGLEFINANCE(ticker)
For example, writing the following in a cell would display the current stock price of
Apple.
=GOOGLEFINANCE("AAPL")
In Google Sheets, it looks like this:
The =GOOGLEFINANCE() function also accepts several attributes that can be used to get
more information about a
stock including the name, current and historical prices.
We will get into more examples of using attributes later, but for an example, using the
"name" attribute like
=GOOGLEFINANCE("AAPL", "name") returns the name of
the company for the stock ticker.
Creating a watchlist
You can easily create a list of stocks that you want to monitor using the real-time
attributes that are available by
default with the =GOOGLEFINANCE() function. To use an attribute just add the attribute as a parameter in the function.
For example, to get the market capitalization, use something like:
=GOOGLEFINANCE("AAPL", "marketcap")
In Google Sheets, it looks like this:
Here are some attributes that can be useful for building a watchlist. For the latest and
full list of attributes, refer
to this page on
Google Support.
- "price" - Real-time price quote, delayed by up to 20 minutes. This is a default attribute.
- "priceopen" - The price as of market open.
- "high" - The current day's high price.
- "low" - The current day's low price.
- "volume" - The current day's trading volume.
- "marketcap" - The market capitalization of the stock.
- "tradetime" - The time of the last trade.
- "datadelay" - How far delayed the real-time data is.
- "volumeavg" - The average daily trading volume.
- "pe" - The price/earnings ratio.
- "eps" - The earnings per share.
- "high52" - The 52-week high price.
- "low52" - The 52-week low price.
- "change" - The price change since the previous trading day's close.
- "beta" - The beta value.
- "changepct" - The percentage change in price since the previous trading day's close.
- "closeyest" - The previous day's closing price.
- "shares" - The number of outstanding shares.
- "currency" - The currency in which the security is priced.
Using these attributes, a watchlist can be built that looks like this:
Ticker or symbol for a particular stock
The easiest way to get the ticker for a particular stock is to perform a search in your
favorite search engine with
the name of the company followed by the word "stock".
For example, in Google, search with the keywords "Apple stock" to get the result
shown below where the stock
ticker is listed as NASDAQ: AAPL.
Now use the symbol in a Google Sheets formula like
=GOOGLEFINANCE("NASDAQ:GOOG") to get the
current price. Notice
that we have removed any blank spaces in the ticker name.
Notice that the symbol contains two parts which are separated by a colon. The part on
the
left of the colon is the
designated exchange code and the part on the right is the symbol or ticker. For US stocks, Google Sheets automatically
grabs the prices if you just use the ticker like =GOOGLEFINANCE("AAPL") but for international
stocks it is best to
specify the designated exchange code along with the ticker with no space in between. To get accurate results and
avoid discrepancies it is recommended to always use the designated exchange code along with the ticker like
=GOOGLEFINANCE("NASDAQ:AAPL").
To get the ticker of Tata Steel which is listed in the National Stock Exchange in India,
a search result
would return something like what is shown below.
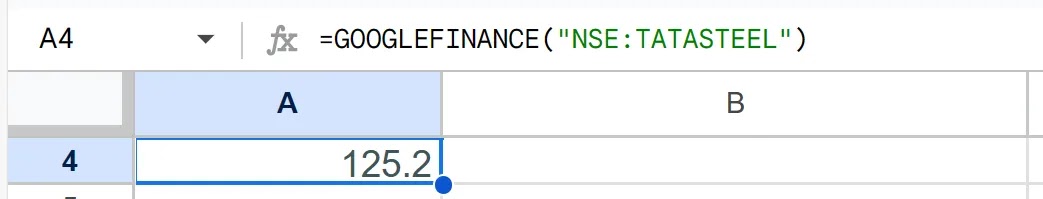
Now use the symbol in a Google Sheets formula like =GOOGLEFINANCE("NSE:TATASTEEL") to get the
current price.
A similar example is the Tessenderlo Group
which is listed in the Brussels Stock
Exchange, for which you can
use =GOOGLEFINANCE("EBR:TESB".
Historical stock price
The historical price of stocks can aid in the analysis for choosing the right pick. The
=GOOGLEFINANCE()
function can also be used to get this historical data by using these attributes.
- "open" - The opening price for the specified date(s).
- "close" - The closing price for the specified date(s).
- "high" - The high price for the specified date(s).
- "low" - The low price for the specified date(s).
- "volume" - The volume for the specified date(s).
- "all" - All of the above.
To get the list of prices for a stock from a start date to an end date use the following
syntax:
=GOOGLEFINANCE(ticker,[attribute],[start date],[end date | number of
days],"DAILY")
For example, the following formula gets the daily closing price of the stock between two
dates:
=GOOGLEFINANCE("NASDAQ:AAPL","price",DATE(2020,1,1),DATE(2020,1,14),"DAILY")
The following formula can be used to get the closing price of a stock for 8 trading
days starting from a particular date:
=GOOGLEFINANCE("NASDAQ:AAPL","price",DATE(2020,1,1),8,"DAILY")
This formula can be used to get the
closing price on trading days since the last 30
days:
=GOOGLEFINANCE("NASDAQ:AAPL","price", TODAY()-30), TODAY(),"DAILY")
The following formula will get all the historical attributes of a stock for 8 trading
days starting from a
particular date:
=GOOGLEFINANCE("NASDAQ:AAPL", "all", DATE(2020,1,1),8,"DAILY")
Charting Historical Prices using SPARKLINE
The =SPARKLINE() function can be used in combination to historical stock prices from
=GOOGLEFINANCE() to display a chart in Google Sheets. The following formula will display a chart plotting the price
trend over the last 90 days for the Apple stock.
=SPARKLINE(GOOGLEFINANCE("NASDAQ:AAPL", "price",TODAY()-90, TODAY()))
Sparklines can be used to enhance your watchlist to provide a miniature visual on how
the
prices are trending.
Mutual Fund Prices
The =GOOGLEFINANCE() function can also be used to grab prices of mutual funds. There are
several attributes to
provide this functionality.
- "closeyest" - The previous day's closing price.
- "date" - The date at which the net asset value was reported.
- "returnytd" - The year-to-date return.
- "netassets" - The net assets.
- "change" - The change in the most recently reported net asset value and the one immediately prior.
- "changepct" - The percentage change in the net asset value.
- "yieldpct" - The distribution yield, the sum of the prior 12 months' income distributions (stock dividends and
fixed income interest payments) and net asset value gains divided by the previous month's net asset value number.
- "returnday" - One-day total return.
- "return1" - One-week total return.
- "return4" - Four-week total return.
- "return13" - Thirteen-week total return.
- "return52" - Fifty-two-week (annual) total return.
- "return156" - 156-week (3-year) total return.
- "return260" - 260-week (5-year) total return.
- "incomedividend" - The amount of the most recent cash distribution.
- "incomedividenddate" - The date of the most recent cash distribution.
- "capitalgain" - The amount of the most recent capital gain distribution.
- "morningstarrating" - The Morningstar "star" rating.
- "expenseratio" - The fund's expense ratio.
For example, to get the last closing price of the Schwab S&P 500 Index Fund, use
something like:
=GOOGLEFINANCE("MUTF:SWPPX", "closeyest")
A combination of these attributes can be used to create a watchlist that looks like
this.
Cryptocurrency Prices
There are limited ways that you can use the =GOOGLEFINANCE() function to grab real-time
prices of some
cryptocurrencies. At the time of this writing, it works with Bitcoin and Ethereum. To do this use the cryptocurrency
symbol that you see in the URL as shown below.
From the URL shown in the example above, you can take the BTC-USD ticker and use it
directly like this in a formula.
=GOOGLEFINANCE("BTC-USD")
This will pull the price and display in a cell in Google Sheets.
Conclusion
To sum up, monitoring stocks, mutual funds and cryptocurrency within Google Sheets is a
potent method for analyze
your holdings. It is user-friendly, adaptable, and doesn't cost a dime. Consequently, you can promptly access both
historical and real-time stock information on your spreadsheet. I hope this article holds some helpful information for
you.
Here is this posted in LinkedIn.


_Brown_Front.webp)
_Brown_Box_Lo.webp)
